Background
When it comes to music, our brain engages in complex creative processes that involve combining elements such as rhythm, pitch, and timbre. Today many musicians spend a significant time recording, editing, and arranging music. This project aims to ease music generation from a sample track. The musicican can hum his melody into his microphone, and the system will generate complementary track.
The first step in generating similar music is to analyze the style. Style includes all elements of music. i.e rhythm, pitch and timbre. Firstly, we detect the pitches, which helps us understand the underlying melody. Firstly, lets define pitch.
Musical notation
Music notation is any system used to visually represent aurally perceived music. Lets take a look at a subset of this notation which deals with pitch.
The chromatic scale is a set of twelve pitches used in music.
$$C \;\; C# \;\; D \;\; D# \;\; E \;\; F \;\; F# \;\; G \;\; G# \;\; A \;\; A# \;\; B$$
These notes are cyclic, therefore C comes after B. A number is used to represent the octave. The interval between any two subsequenct notes is a semi-tone.
A4 is usually used as the reference note with frequency 440Hz. A5 is thus an octave higher (880Hz).
MIDI
MIDI (Musical Instrument Digital Interface) is a standard interface recognized by several musical instruments and processors. In MIDI the middle C note (C4) is represented with the number 60. A note that is a semitone higher is represented by a number one higher than the previous. Similary, a note that is a semitone lower is represented by a number one less than the previous. For A4, which is 9 semitones higher than C4, the midi representation is 69.
Mapping frequency to musical notation
We can leverage MIDI to convert frequency to musical notation.
The function to convert a frequency to MIDI number is:
$$ M(f) = 69 + 12 \cdot \log_2{\frac{x}{440}} $$
Then we can map the MIDI number to notation from the definition of MIDI.
Pitch Detection using Autocorrelation
There are several methods that can be used for pitch detection. AMDF, ASMDF, YIN algorithm, MPM algorithm, Harmonic product spectrum, Cepstral analysis, and Autocorrelation are some popular approaches. More recently, machine learning has also been employed for this.
For our project we chose to use autocorrelation since it strikes a perfect balance between complexity and accuracy. Let us look at how autocorrelation works.
Periodic nature of music
After we zoom into the signal, we can see that the signal is periodic. All musical signals have some perceiveable periodicity to them. This feature can be exploited to determine the frequency of the signal.
It is to be noted that a signal can have multiple periodicities. And often, this is the case. When you look at a single note produced by an insturment, we can observe that it is not a pure sine wave. This is because multiples of fundamental frequency is also present in the signal (called overtones) This is the reason why the signal is not a perfect sine wave.
Autocorrelation
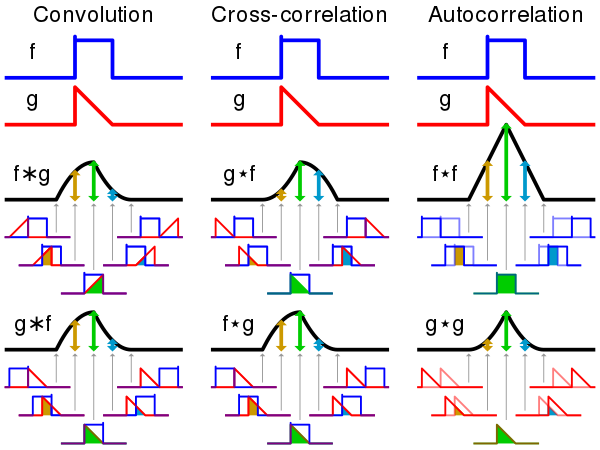
Autocorrelation, sometimes known as serial correlation in the discrete time case, is the correlation of a signal with a delayed copy of itself as a function of delay. This is similar to a cross-correlation operation, which itself is similar to a convolution.
Lets start with the convolution function:
$$c(t) = \int_{-\infty}^{\infty}{f(x) g(t-x) dx}$$
The formula states that a convolution is a mathematical operation on two functions (f and g) that produces a third function (f * g) that expresses how the shape of one is modified by the other.
One of the functions is flipped about the y-axis and offset by a certain amount first. Then the functions are multiplied and integrated over their domains.
For cross-correlation we perform a convolution without flipping the function about the y-axis. Therefore the formula becomes,
$$c(t) = \int_{-\infty}^{\infty}{f(x) g(x-t) dx}$$
Similarly, for autocorrelation we perform cross-correlation with the same function.
Thus, the mathematical formula for autocorrelation is as follows:
$$a(t) = \int_{-\infty}^{\infty}{f(x) f(x - t) dx}$$
For the discrete case, this becomes,
$$a(t) = \sum_{x = 0}^{N}{ f(x)f(x-t)}$$
The figure below illustrates the three functions
Now, how can we use autocorrelation to figure out the frequency?
Autocorrelation gives you correlation of a signal with its delayed version. When the correlation is high, we can deduce the signal is periodic at that offset.When the correlation is low, the signal is not periodic yet.
Therefore we can figure out the time delta when the signal becomes periodic. This time delta can be used to figure out the frequency of the signal.
Limitations
A naive implementation of autocorrelation that selects the first instance of periodicity, will always prefer higher octaves. Since higher frequencies show their periodic nature faster. This is also known as "octave-error" which is a common limitation of autocorrelation. This can be circumvented partly. We can switch to the frequency domain, and look at the frequency with highest intensity. Similarly, we can simply filter improbable notes which are too high to sing/play. It is also possible to not select the first instance of periodicity, but instead select the most probable one.
Spectogram
A spectogram is a 2D representation of a signal. It is a visual way of representing the signal strength, or “loudness”, of a signal over time at various frequencies present in a particular waveform. This is useful for audio analysis because this is a complete description of a signal which contains constituent frequencies at every time interval.
The strength f(A) is represeted in decibels (dB) which is a standard logarithmic scale over amplitude (A). Humans also perceive strength of a audio signal logarithmically.
$$ f(A) = 10 \cdot \log_{10}{A} $$
PROGRESS
Pitch Detection: upgraded from Auto correlation algorithm to pYIN algorithm.
Chord progression: Data scrapping -> scraped UltimateGuitar webisite for 5k songs of varied genres. Preprocessing -> automated data clean up with custom scripting, data augumentation. Generate Chord2VecEmbeddings -> (Model learns music theory) Models implemented -> as part of the the learning process we implemented Vanilla Neural network, RNN and LSTM with accuracy of ..%, ..% and 81% accuracy. Currently researching on other models like Trasnformers and TCN. Decide on the final model after careful evaluation.
Melody generation: Data -> downloaded midi data of over 10k songs spanning over half a decade of released popular songs. preprocessinh -> Active in this stage. Models -> Not implemented yet.
UI: Basic web UI implemented using HTML, Javascript, css and Flask(plan to finish this after completion of the generation models)